
As a marketing guru, your primary concern is selecting the most suitable infographic video maker that aligns with your content and promotional requirements for effective data visualization— often happens in your mindset!
Over the past decade, infographics have gained huge approval within the graphic design domain, a favored tool among marketers and businesses. Infographic animations are a way to go, particularly with the general taking on video as a promotional medium on the internet.
As per the Content Marketing Industry Report of 2020, 67% of B2B marketers used infographics. As per 2020 (Venngage) study, 70% of businesses start going for visual content heavily in their marketing efforts in 2021 and onwards— the most central content format for their businesses.
However, it’s common for marketers and entrepreneurs to encounter challenges in the creation of infographics, often finding it to be a time-consuming and costly endeavor. If you fall into this category, here’s good news: the arrival of infographic video maker like Animetus has come to rescue you from producing high-quality infographic videos at a high cost.
The sole query that should occupy a marketer’s mind is the selection of the optimal infographic video maker (content and promotional requisites) for data visualization. Here, we will address this inquiry—guidance to achieve proficiency and create impactful infographics.
What’s an Infographic Video Maker?
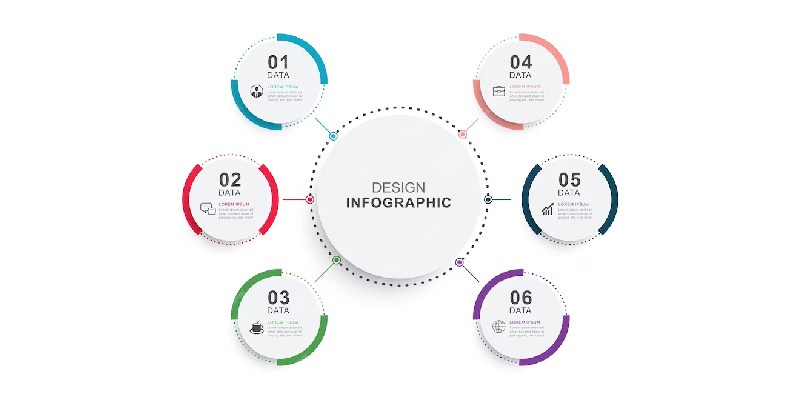
For strong professionalism, an infographic is a visual composition merging images and data visualization like pie charts and graphs, along with concise text— a clear and comprehensible explanation of a subject matter.
With captivating visuals, an infographic quickly and well takes information to its intended audience, like customers, vendors, and other internet users.
Examples of infographics crafted via an infographic video maker encompass various types:
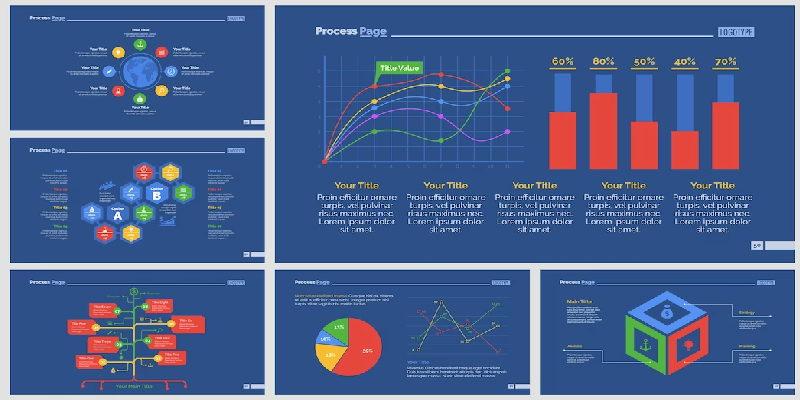
- Statistical Infographics: These graphical elements are charts and graphs visually show statistical data. For instance, a bar chart illustrating product sales figures for the last quarter.
- Informational Infographics: These utilize icons and minimal text to present information or facts engagingly. An example is an infographic outlining the benefits of regular exercise.
- Timeline Infographics: They show timelines or chronological sequences of events/milestones to help understand historical or time-based information. Imagine an example of a timeline of the History and milestones of a business.
- Process Infographics: These make it easy to understand and share detailed instructions for complicated processes. A cake-baking infographic is one example.
- Geographic Infographics: It depicts location-based data via maps and geographical elements. An example would be a map showing population density by different cities in the country.
- Hierarchical Infographics: These are shapes or diagrams nested within other shapes or diagrams that represent hierarchies or structures of information. Imagine a chart showing an organization’s hierarchical structure, from CEO to various teams.
- List Infographics: They put information as a list — making it easier to read and navigate. One example would be a list of 10 travel locations, with a quick description for each and a picture for visual reference.
- Resume Infographics: Graphics and concise text briefly present an individual’s credentials, capabilities, and experience in visually styled CVs or resumes.
Infographics currently come in two forms of data visualization: static infographics and video infographics.
Static Infographic:
A static infographic combines artistry with data compilation to deliver visually rich and informative presentations.
Its versatility and capacity for data aggregation make it a valuable tool.
With static infographics, you can craft timelines, bar graphs, descriptions of business assets, or display case sales records. Consequently, it proves highly effective for brand promotion.
Video Infographic:
A video infographic surrounds mixing many animations to produce an engaging informational video for data explanation. Video infographics has some advantages for marketers:
- They permit the integration of diverse media types into presentations, a capability absent in static infographics reliant solely on images.
- Information becomes more accessible and dynamic through sequences and subtitles — for those who prefer motion graphics and animations over static imagery.
- They enrich storytelling with your visual identity in the video.
- Video infographics are easily shareable on social media platforms, particularly on Pinterest and Instagram.
Who practices infographics regularly?
Infographics, due to their user-friendly and enjoyable nature, serve a wide range of professions across various project types. These include content creators, marketers, businesses, educators, and nonprofit organizations.
- Content creators and marketers utilize infographics to drive web traffic, enhance visibility, raise brand awareness, and foster client engagement.
- Educators and trainers employ infographics to simplify complex information for their students or trainees.
- Companies leverage infographics to present business data and financial statements more engagingly for stakeholders, senior management, employees, and others.
- Nonprofit organizations utilize infographics to raise awareness about social causes and issues.
- Regardless of your circumstances, it’s essential to carefully assess your infographic needs based on your activities and objectives. Are you planning internal training? Do you aim to present financial statements attractively? Or do you want to disseminate information about a specific cause?
Your goals and requirements will determine the most suitable infographic format. If you need more clarification about your choice, you can seek inspiration from Animetus’ available infographic examples.
The Prevalence of Video Infographics Created with Infographic Video Makers Today
Video infographics hold on the rise worth in corporate communication strategies, attributed to various factors.
Infographic’s Sudden Attention Capture

One of the primary reasons for the amassed fame of video infographics is their ability to swiftly capture viewers’ attention. Numerous studies have demonstrated that people remember visual information far better than textual content.
In fact, the human brain processes visual details a staggering 60,000 times faster than written words. Consequently, aesthetically fair infographics are more engaging and enjoyable for audiences than plain text.
Demonstrating Expertise
Video infographics serve as a testament to one’s expertise in marketing or other fields. Data and statistics play a pivotal role in every operation in today’s landscape. Every endeavor demands meticulous measurement through figures, charts, and percentages. A well-crafted video infographic can effectively showcase in-depth research on a subject to shore up one’s credibility in the marketplace.
Enhanced Comprehension of Complex Information

Video infographics excel at making intricate data and graphs comprehensible and dynamic. They are presented clearly and engagingly, resonating with the intended audience and making even the most puzzling information.
Stirring Brand Value
Video infographics extend beyond the narrative of a brand. Fit essential brand elements—logos, visual identity, and contact information, into the video is crucial. This reinforcement not only strengthens brand recognition but also underscores professionalism and consistency.
Search Engine Ranking Boost
With infographics, you can significantly boost a website’s ranking on popular search engines such as Google, Yahoo!, and Bing. Content featuring relevant images, like infographics, garners 94% more views than content devoid of such visuals.
Thus, viewers who take part in your infographics are more liable to link back to your online site as the source. This influx of backlinks contributes to improved search engine rankings, enhancing your online visibility.
4 standards to support you in deciding on the Grade A infographic video maker

The 2020 Content Marketing Industry Report revealed that 43% of content marketers found visual content, such as infographics, their primary challenge to craft. Traditionally, marketers and companies would seek out infographic designers, incurring additional costs.
However, it has gone forward with the rise of infographic-making tools in the market. Vanished the time when only creative experts could create infographics. Nowadays, even individuals who have design expertise can generate infographics online. Several options are available, including Canva, Visme, and Animetus.
Nevertheless, opting for the most suitable infographic creator is a complex endeavor. Multiple factors require assessment before making a definitive decision.
Element #1: User-Friendly Interface and Multimedia Resources
Ease of use is paramount for the ideal infographic maker— a healthy library of readily available multimedia resources like videos, images, music, shapes, voice-overs, and widgets. These resources will highly aid in efficiently creating and editing video infographics.
Element #2: Diverse Templates and Voice-Over Options
The perfect infographic maker should offer a variety of templates and, if necessary, incorporate voice-over capabilities. These templates should be adaptable to your brand and facilitate a swift start to your projects.
Element #3: Streamlined Team Collaboration
The infographic maker should facilitate seamless collaboration within your creative teams. Animetus, for instance, has a team wall feature designed precisely for this purpose, enabling easy sharing and modification of different infographic projects among team members.
Element #4: New User Onboarding and Support
An ideal infographic maker should arrange for support for newcomers to get on their projects. It should have a user-friendly interface to familiarize users with the software; you can allow them to work independently. Animetus excels in this aspect via a Customer Success Manager Team dedicated to supporting new users throughout their journey on the platform.
Contact Animetus to create your first or Next Infographic Video.
Would you be interested in outstanding infographics, beating the quality of static infographics, with the backup of our A-grade infographic video maker? Our expertise allows you to incorporate subtitles and utilize high-quality voice-overs with data visualization methods like charts, plots, Heatmaps, histograms, etc.
You can even infuse motion graphics and easily adhere to your brand guidelines.
With our professional video production services in the US, you can craft stunning infographics for your social media audience in a frank process.
Request a demo now to explore the capabilities of Animetus, a user-friendly team of 3D and 2D animation services in the US; review our portfolio of infographic examples to gain inspiration and insights.