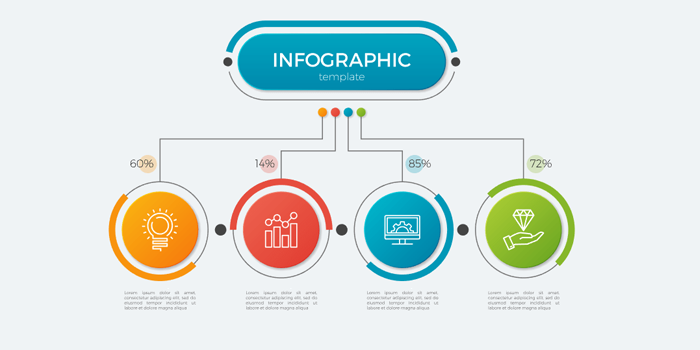
Infographic is a colorful presentation of your content that increases the visual appeal of customers. They are a powerful and successful tool for a logo animation company and give your content a competitive edge over others. You can use info-graphics in your blogs, social media, and email newsletters.
They provide a piece of factual and statistical information to readers and combine graphics to boost the value and demand of your content. The term info-graphics consists of information and images and combines both to show a well-balanced combination of text and animation. They add a true sense of creativity and interactivity to your blog and social media posts and bring value to readers.
Designing an infographic is an excellent way to grab attention and develop engagement in your content. Plenty of free and paid tools are there to build dynamic and stunning infographic visuals in few minutes. They prevent a lot of time and effort for a designer to sit for hours with SEO or a content writer. A senior designer listens to their ideas of a content writer and uses his creative and artistic skills to present a visual info-graphic post.
Here are a few intelligent techniques on how to create animated infographics for your business:
Determining The Purpose

Before starting with engaging info-graphics content, it is necessary to determine the core purpose of creating such a post. You need to evaluate the end goal of making an effort and creating awesome colorful content that delivers meaningful information to readers. It describes the authentic facts, figures, and numbers to increase visitors’ knowledge and compels them to stay.
The purpose of infographics is to present the gathered data attractively to your target audience. It develops their interest and captivates their attention to read the content. You can even humorously explain the serious statistics to educate and entertain readers.
Doing Research work and Gathering Valuable Data

Research is a prerequisite for creating infographics. The purpose of info-graphics is lost without doing extensive research work. It is necessary to develop info graphs and provide a lot of knowledge and the latest information to readers. Numerous ways are there to collect data from different resources, such as fundamental research, advanced research, and miscellaneous research findings.
The primary research comes from conducting interviews, surveys, and case studies. Secondary research comprises reading trade journals and examining other researchers’ work. Lastly, the miscellaneous research derives from the market analysis and community forum groups. You can also multiple tools to find authentic sources of data.
Focusing On The Types Of Infographics

As a business, your point of focus should be on finding the types of visual infographics. They are the creative asset to your company and boost the value and demand for your organization in the market. It can include many things such as research statistics, facts, figures, data, maps, charts, and numbers. Understand the meaning and purpose of every element to give a definite value to your infographics posts.
Creating A Narration And Storytelling

Infographic is a visual representation of your content. It represents your content and adds value to your blogs and social media posts. Including a storyline gives an actual worth to your content and differentiates it from mere graphics. A compelling storyline builds a strong connection and draws the attention of readers to read and inspire your posts. You can include a beautiful voiceover and enhance it with background music to double the demand for your content among customers. It is up to you to add a little or more humor and emotion in your video graphics to retain the focus of your customers.
Producing The Visual Content

Producing the visual content requires a lot of thinking and brainstorming by the designer and marketer. After creating the infographics design, the first thing you need to do is compile the complete data information. Arrange the storyline in proper order and connect the characters together with each other. Create a compelling script and add the factual data. Include the music and voiceover in the background and preview the video for once.
Crafting The Masterpiece Infographics Video

Creating the stunning infographics video contains some essential elements of accuracy, precision, optimization, and catchy attraction. These features increase the level of perfection in a video and make it appealing and awe-inspiring by customers. Gather authentic sources of data information and optimize SEO content to bring the desired results for clients.
Bottom Line
Hence, in a nutshell, those mentioned above are helpful information regarding the creation and marketing of infographics for your business. It provides the superb quality of data gathered from multiple sources to deliver the right message to your target audience. The benefit of using infographics is to provide the best motion graphics video to your customers and engage them for a longer time. You can manually design an infographic post or automate it according to all your clients’ requirements.

